Industry news
Global Pain Relief Patch Market: USD 4.8B in 2024 to USD 7.6B by 2030
Industry news 2026-07-13 11:11:17 138 views admin
Global Pain Relief Patch Market: USD 4.8B in 2024 to USD 7.6B by 2030
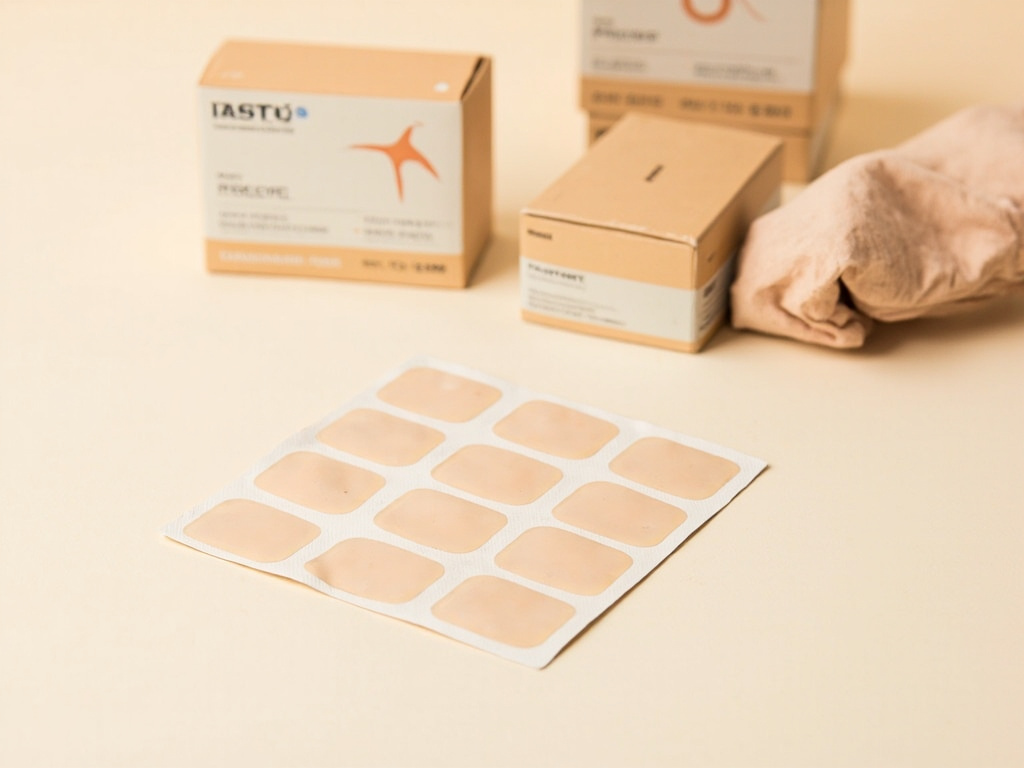
The global pain relief patch market reached USD 4.8 billion in 2024 and is projected to hit USD 7.6 billion by 2030, growing at a 7.9% CAGR according to a 2024 Grand View Research report. The Asia-Pacific region accounts for 42% of total consumption, with China, Japan, and South Korea leading both production and demand. North America follows at 28%, driven by an aging population and growing preference for non-opioid pain management solutions.
What's Driving the Growth?
The expansion comes from three converging trends. First, demographic shift: people over 60 now represent 16% of the global population and this group spends 2.3x more on pain management products than younger demographics. Second, regulatory pressure on opioids: the CDC's 2022 opioid prescription guideline pushed prescribers and patients toward topical alternatives, increasing pain patch demand by 18% year-over-year in the US. Third, direct-to-consumer wellness brands: over 600 new DTC patch brands launched between 2021 and 2024, mostly on Amazon and Shopify, all requiring OEM manufacturing partners.
Where the OEM Opportunity Sits
Most manufacturing capacity sits in China, Korea, and India. China alone hosts an estimated 1,200+ certified patch factories, of which roughly 300 serve export markets. Korean manufacturers focus on hydrogel-based patches with higher unit prices (USD 0.40-0.80 per piece), while Chinese factories dominate fabric-backed adhesive patches at USD 0.10-0.30 per piece. For new brand owners, the lower MOQ (10,000-50,000 pieces) offered by Chinese OEM partners makes them the practical entry point.
2024 Market Segments by Patch Type
| Patch type | 2024 share | 2030 forecast | CAGR |
|---|---|---|---|
| Herbal heat patches | 31% | 35% | 9.1% |
| Pain relief (chemical) | 28% | 24% | 5.2% |
| Cooling/fever patches | 18% | 22% | 10.3% |
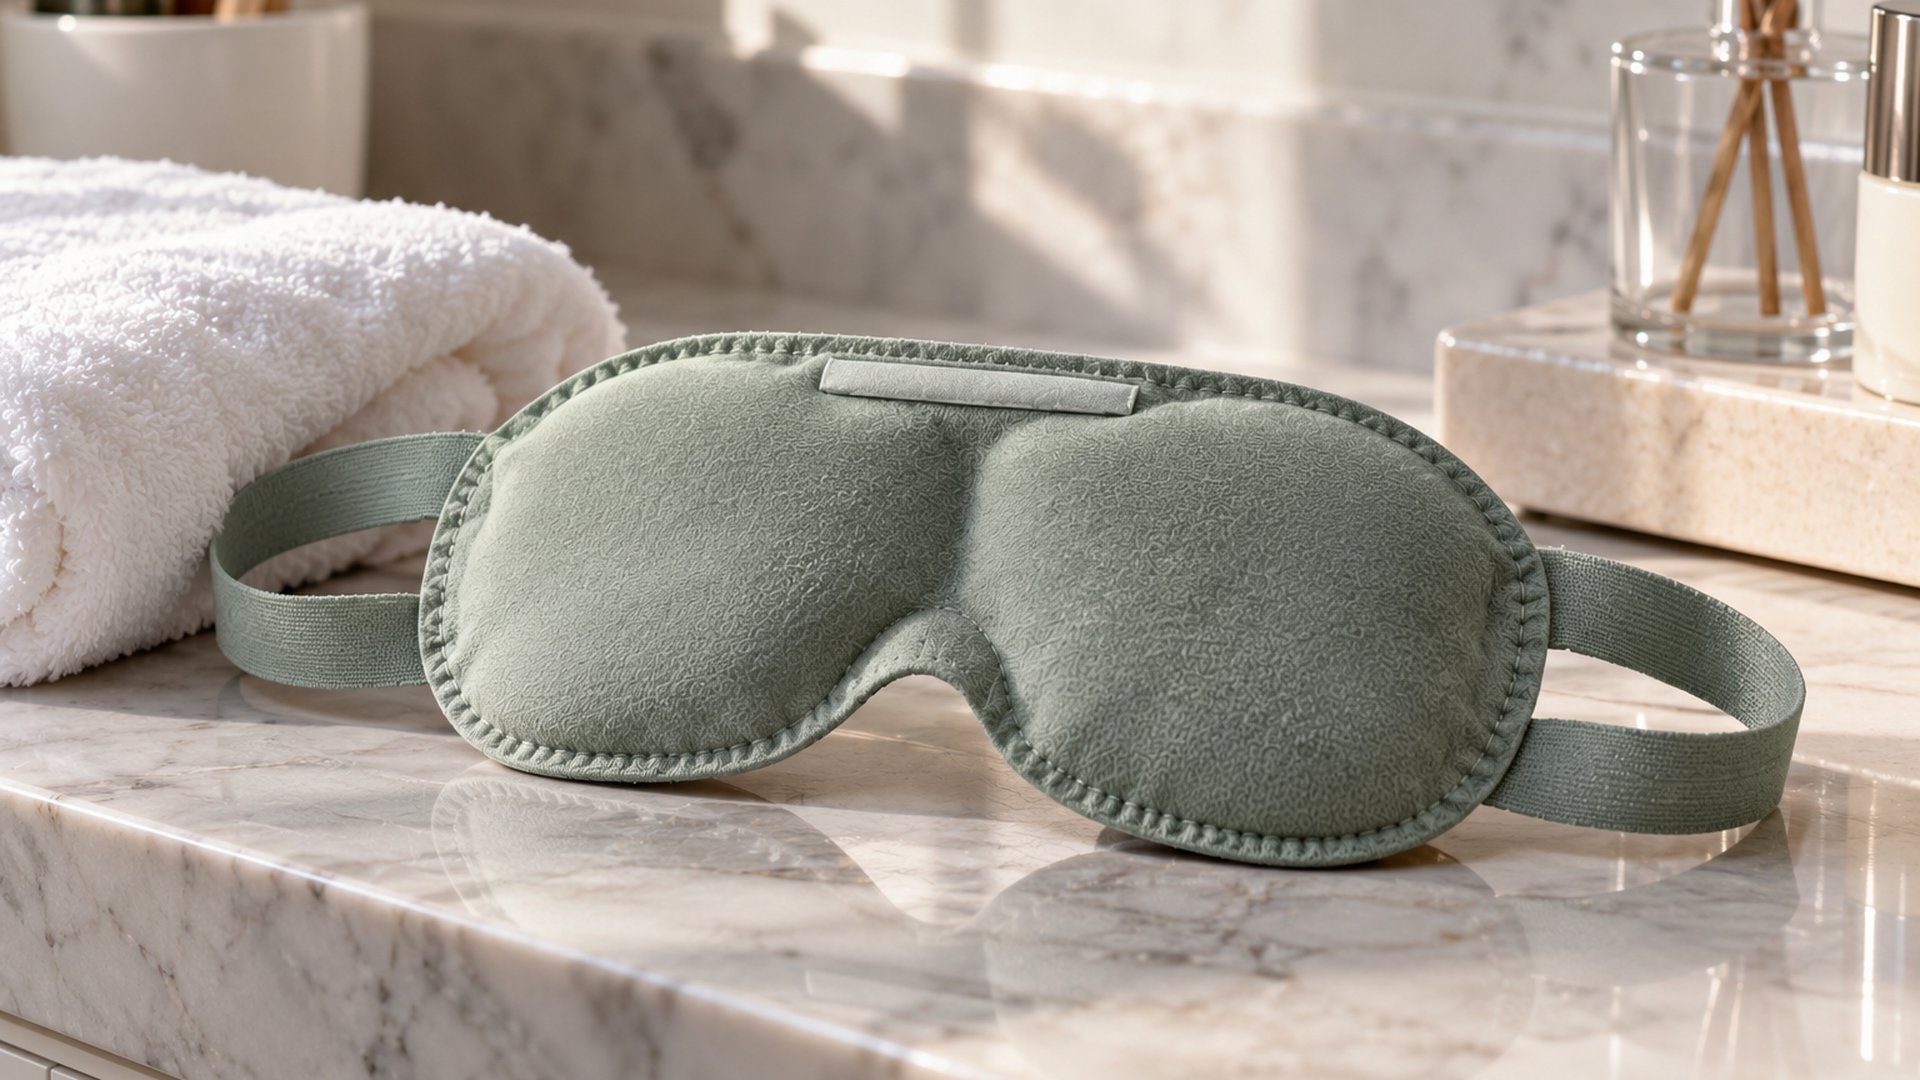
| Cooling eye masks | 12% | 14% | 11.0% |
| Other (motion sickness, sleep) | 11% | 5% | 3.8% |
Herbal heat patches and cooling products are the fastest-growing segments, both tied to consumer preference for natural ingredients and drug-free solutions.
Frequently Asked Questions
Q: Which region offers the lowest OEM manufacturing cost?
Chinese factories offer the lowest unit cost (USD 0.10-0.30 per piece for standard fabric patches). Indian manufacturers are competitive for herbal ingredient processing, while Korean factories lead in hydrogel technology but at 2-3x the unit cost.
Q: What's the realistic MOQ for a new brand entering the market?
Most Chinese OEM factories accept 10,000 pieces per SKU for established formulas, or 30,000-50,000 pieces for custom formulations. Some offer lower MOQs (3,000-5,000) for stock designs with custom packaging.
Q: How long does OEM production typically take?
Standard production lead time is 15-30 days after sample approval. Custom formulation adds 30-45 days for R&D and stability testing. First-time orders usually require an additional 7-10 days for export documentation and certifications.
Q: Which certification matters most for US/EU export?
For US, FDA establishment registration plus product listing is mandatory. For EU, CE marking under the Medical Device Regulation (MDR) is required for medical claims. ISO 13485 is the baseline quality management standard accepted globally.
Henan Hanmeng Bio-Tech operates a 12,000 sqm GMP-certified facility in Henan, serving 200+ brand clients across 30 countries. With in-house R&D, 15 production lines, and FDA/CE documentation support, the company handles full-cycle OEM from formula development to export-ready packaging.
Keywords: global pain relief patch market 2024, herbal heat patch market size, OEM patch manufacturer China, transdermal patch industry trends
Looking for a Custom Patch Manufacturer?
Henan Hanmeng Bio-Tech produces private-label pain relief patches, herbal heat patches, cooling patches, nasal strips, and hydrocolloid patches on certified production lines. FDA, EU CE, and ISO 13485 documentation included. Samples shipped in 7 days; bulk MOQ negotiable.
View Our OEM Catalog Request a Quote
Henan Hanmeng Bio-Tech · Henan, China · +86 17796669065 · 396269538@qq.com
CATEGORIES
LATEST NEWS
- Sinew-Bone Pain-Bi Patch Private Label Manufacturer Supply Agreements
- What Hand Mask Custom Packaging Supplier Quotes Overlook
- Kids Herbal Foot Patch Contract Manufacturer: Safety Specifications First
- Mugwort Steam Eye Mask Private Label Manufacturer Readiness Check
- Mugwort Essential Oil Custom Formula Supplier: Formulation Approval Milestones
CONTACT US
QQ: 396269538
Phone: 17796669065
Tel: 17796669065
Email: 396269538
Add: Room 001, 1st Floor, Building 1, Zhengzhou Hangmei International Smart City, Intersection of S102 and Nanquan Road, Xuedian Town, Xinzheng City, Zhengzhou, Henan Province, China